Every day between the end of the Sixers' regular season and the NBA Draft Lottery on May 12, we will use Tankathon.com's famous simulation tool to run through the lottery 10 times. Over a 29-day period, we will collect a significant sample of possible outcomes and track those results as the Sixers wait to learn the fate of their own first-round pick.
The Sixers are entering the lottery with the fifth-best set of odds, but they will only keep their first-rounder if it falls in the top six slots due to an obligation to the Oklahoma City Thunder from a trade made nearly five years ago.
Let's get to today's simulations:
Today's results
The outcomes of today's batch of 10 simulations:
• Simulation No. 1: 7th pick
• Simulation No. 2: 6th pick
• Simulation No. 3: 4th pick
• Simulation No. 4: 7th pick
• Simulation No. 5: 7th pick
• Simulation No. 6: 4th pick
• Simulation No. 7: 6th pick
• Simulation No. 8: 4th pick
• Simulation No. 9: 3rd pick
• Simulation No. 10: 8th pick
MORE: Jared McCain year-in-review
Best simulation of the day
The Sixers landed at No. 3 once in this batch of simulations, but three times ended up with the No. 4 overall pick:
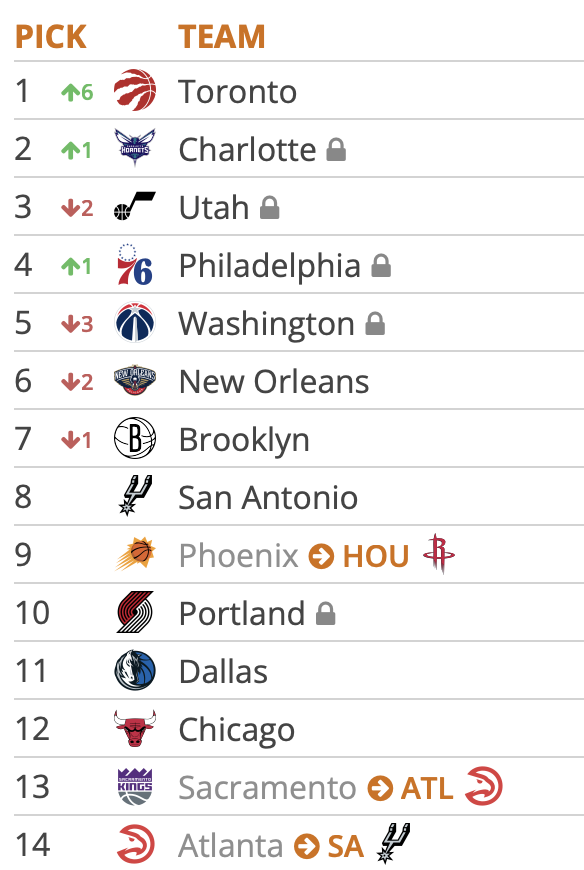
Unless Rutgers wing Ace Bailey's stock plummets, he appears set to round out the top three spots after Duke phenom Cooper Flagg and Bailey's teammate, guard Dylan Harper. That would leave the Sixers capable of going in all sorts of directions at No. 4, where there is not yet any sort of consensus about who is next on the board.
Worst simulation of the day
XXX
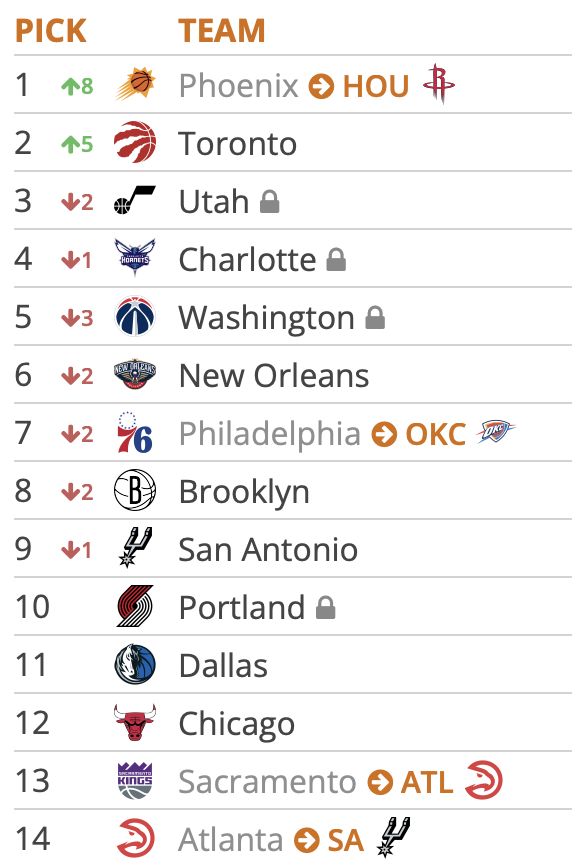
The Toronto Raptors jumping into position to select Harper while the Sixers come away empty-handed would be devastating for a Sixers team that went above and beyond to outpace Toronto in the tanking race.
Overall results
The cumulative results of this exercise so far:
| Draft Pick | Simulation Outcomes | Simulation Outcome Percentage | Actual Percentage Odds |
| 1 | 14 | 12.7% | 10.5% |
| 2 | 14 | 12.7% | 10.5% |
| 3 | 8 | 7.2% | 10.6% |
| 4 | 10 | 9.0% | 10.5% |
| 5 | 2 | 1.8% | 2.2% |
| 6 | 22 | 20.0% | 19.6% |
| 7 | 30 | 27.2% | 26.7% |
| 8 | 9 | 8.1% | 8.7% |
| 9 | 1 | 0.0% | 0.6% |
| Keep or Lose Pick? | Simulation Outcomes | Simulation Outcome Percentage | Actual Percentage Odds |
| Kept Pick | 70 | 63.6% | 64.0% |
| Lost Pick | 40 | 36.3% | 36.0% |
MORE: Joel Embiid year-in-review
Follow Adam on Twitter: @SixersAdam
Follow PhillyVoice on Twitter: @thephillyvoice