Every day between the end of the Sixers' regular season and the NBA Draft Lottery on May 12, we will use Tankathon.com's famous simulation tool to run through the lottery 10 times. Over a 29-day period, we will collect a significant sample of possible outcomes and track those results as the Sixers wait to learn the fate of their own first-round pick.
The Sixers are entering the lottery with the fifth-best set of odds, but they will only keep their first-rounder if it falls in the top six slots due to an obligation to the Oklahoma City Thunder from a trade made nearly five years ago.
Let's get to today's simulations:
Today's results
The outcomes of today's batch of 10 simulations:
• Simulation No. 1: 7th pick
• Simulation No. 2: 3rd pick
• Simulation No. 3: 1st pick
• Simulation No. 4: 1st pick
• Simulation No. 5: 2nd pick
• Simulation No. 6: 2nd pick
• Simulation No. 7: 7th pick
• Simulation No. 8: 1st pick
• Simulation No. 9: 8th pick
• Simulation No. 10: 4th pick
MORE: Tyrese Maxey year-in-review
Best simulation of the day
How about three lottery victories for the Sixers in today's batch? One of those simulations featured plenty of movement:
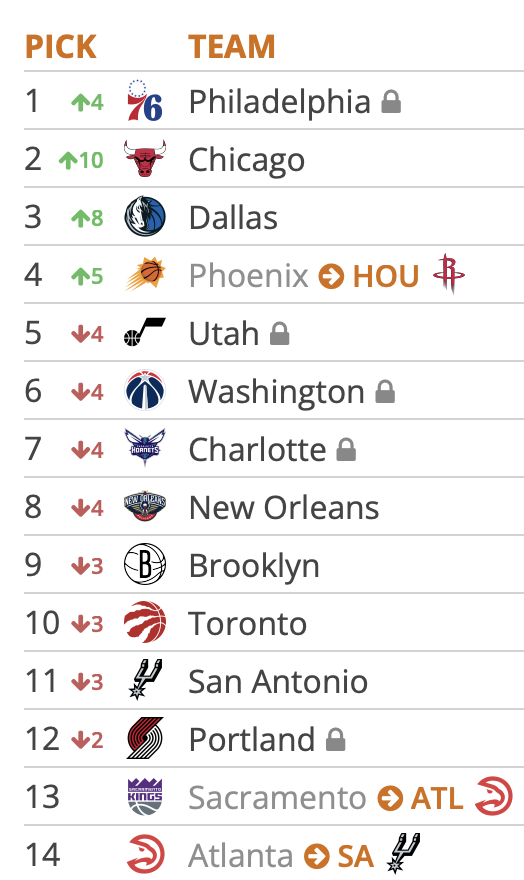
Meanwhile, the Dallas Mavericks can absolutely not be rewarded with any kind of lottery luck next month.
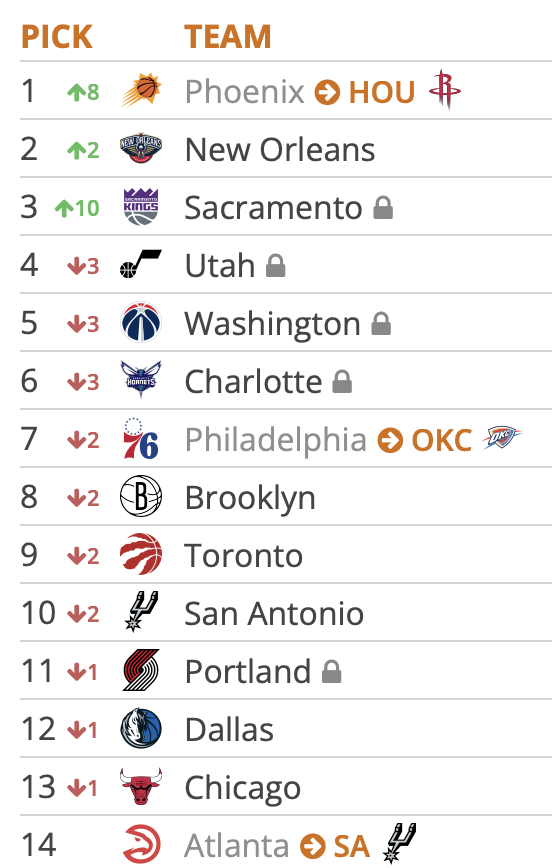
Worst simulation of the day
The Sixers dropped to No. 7 twice and out of their top-six protected range three times in today's collection of simulations, but the very first one was particularly wild:
Cooper Flagg in Houston would be remarkable — and it happening with a pick that originally belonged to the Phoenix Suns would be fitting for one of the few NBA teams that can make an argument their 2024-25 campaign was just as disappointing as that of the Sixers.
Overall results
The cumulative results of this exercise so far:
| Draft Pick | Simulation Outcomes | Simulation Outcome Percentage | Actual Percentage Odds |
| 1 | 14 | 14.0% | 10.5% |
| 2 | 14 | 14.0% | 10.5% |
| 3 | 7 | 7.0% | 10.6% |
| 4 | 7 | 7.0% | 10.5% |
| 5 | 2 | 2.0% | 2.2% |
| 6 | 20 | 20.0% | 19.6% |
| 7 | 27 | 27.0% | 26.7% |
| 8 | 8 | 8.0% | 8.7% |
| 9 | 1 | 1.0% | 0.6% |
| Keep or Lose Pick? | Simulation Outcomes | Simulation Outcome Percentage | Actual Percentage Odds |
| Kept Pick | 64 | 64.0% | 64.0% |
| Lost Pick | 36 | 36.0% | 36.0% |
MORE: Paul George year-in-review
Follow Adam on Twitter: @SixersAdam
Follow PhillyVoice on Twitter: @thephillyvoice